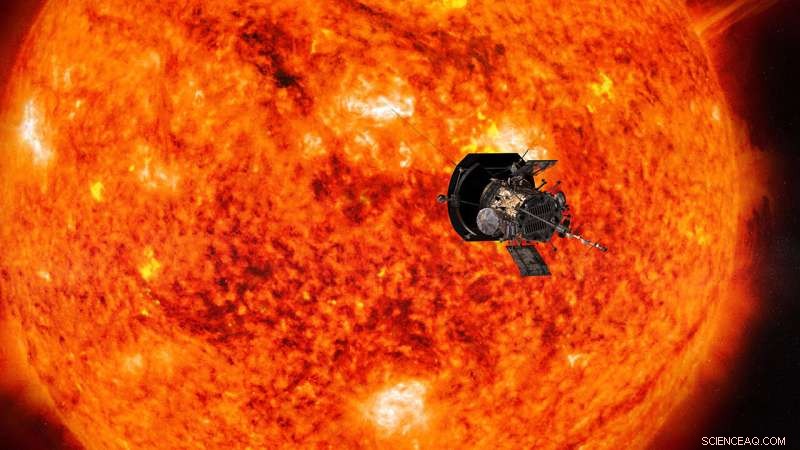
Illustration de Parker Solar Probe s'approchant du soleil. Crédit : NASA/Johns Hopkins APL/Steve Gribben
Au cœur de la compréhension de notre environnement spatial se trouve la connaissance que les conditions dans tout l'espace, du soleil aux atmosphères des planètes en passant par l'environnement de rayonnement dans l'espace lointain, sont liées.
L'étude de cette connexion, un domaine scientifique appelé héliophysique, est une tâche complexe :les chercheurs suivent les éruptions soudaines de matière, radiation, et des particules dans le contexte de la sortie omniprésente de matière solaire.
Une confluence d'événements au début de 2020 a créé un laboratoire spatial presque idéal, combinant l'alignement de certains des meilleurs observatoires de l'humanité, y compris Parker Solar Probe, lors de son quatrième survol solaire - avec une période calme dans l'activité du soleil, quand il est plus facile d'étudier ces conditions de fond. Ces conditions ont fourni une occasion unique aux scientifiques d'examiner comment le soleil influence les conditions à des points dans l'espace, avec de multiples angles d'observation et à différentes distances du soleil.
Le soleil est une étoile active dont le champ magnétique se propage dans tout le système solaire, transporté dans le flux constant du soleil de matière appelée le vent solaire. Il affecte les engins spatiaux et façonne les environnements des mondes dans tout le système solaire. Nous avons observé le soleil, l'espace proche de la Terre et d'autres planètes, et même les bords les plus éloignés de la sphère d'influence du soleil pendant des décennies. Et 2018 a marqué le lancement d'une nouvelle observatoire révolutionnaire :Parker Solar Probe, avec un plan pour voler à environ 3,83 millions de milles de la surface visible du soleil.
Parker a maintenant eu quatre rencontres rapprochées du soleil. (Les données des premières rencontres de Parker avec le soleil ont déjà révélé une nouvelle image de son atmosphère.) Au cours de sa quatrième rencontre solaire, couvrant une partie de janvier et février 2020, le vaisseau spatial est passé directement entre le soleil et la Terre. Cela a donné aux scientifiques une opportunité unique :le vent solaire que Parker Solar Probe a mesuré lorsqu'il était le plus proche du soleil aurait, jours plus tard, arriver sur Terre, où le vent lui-même et ses effets pourraient être mesurés à la fois par des engins spatiaux et des observatoires au sol. Par ailleurs, les observatoires solaires sur et près de la Terre auraient une vue claire des emplacements sur le soleil qui ont produit le vent solaire mesuré par Parker Solar Probe.
"Nous savons d'après les données de Parker qu'il existe certaines structures originaires de ou près de la surface solaire. Nous devons examiner les régions sources de ces structures pour bien comprendre comment elles se forment, évoluer, et contribuer à la dynamique du plasma dans le vent solaire, " a déclaré Nour Raouafi, scientifique du projet pour la mission Parker Solar Probe au Johns Hopkins Applied Physics Laboratory à Laurel, Maryland. "Les observatoires au sol et d'autres missions spatiales fournissent des observations complémentaires qui peuvent aider à dresser une image complète de ce que Parker observe."
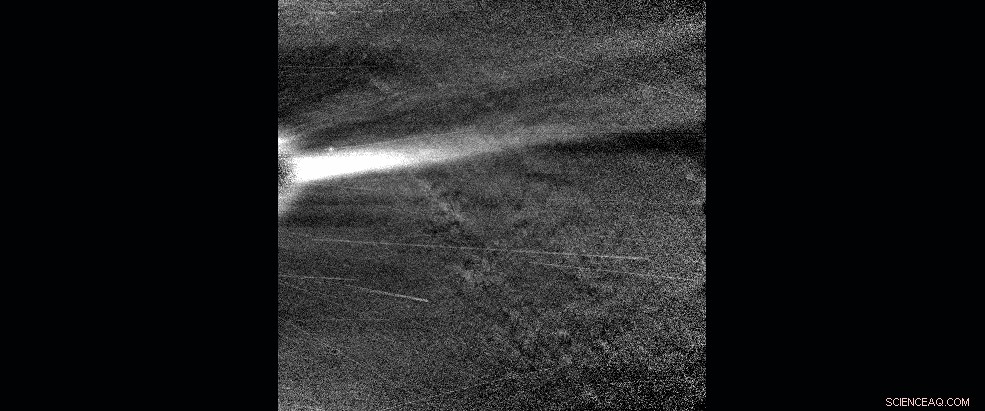
Cette séquence animée d'images en lumière visible de l'instrument WISPR de Parker Solar Probe montre une banderole coronale, observé lorsque Parker Solar Probe était proche du périhélie le 28 janvier 2020. Crédit :NASA/Johns Hopkins APL/Laboratoire de recherche naval/Parker Solar Probe
Cet alignement céleste intéresserait les scientifiques en toutes circonstances, mais elle a également coïncidé avec une autre période astronomique d'intérêt pour les scientifiques :le minimum solaire. C'est le point pendant le soleil régulier, cycles d'activité d'environ 11 ans lorsque l'activité solaire est à son plus bas niveau, donc des éruptions soudaines sur le soleil telles que les éruptions solaires, les éjections de masse coronale et les événements de particules énergétiques sont moins probables. Et cela signifie qu'étudier le soleil près du minimum solaire est une aubaine pour les scientifiques qui peuvent observer un système plus simple et ainsi démêler quels événements provoquent quels effets.
"Cette période offre des conditions parfaites pour tracer le vent solaire du soleil à la Terre et aux planètes, " dit Giuliana de Toma, un scientifique solaire à l'observatoire de haute altitude à Boulder, Colorado, qui a dirigé la coordination entre les observatoires pour cette campagne d'observation. "C'est un moment où l'on peut suivre plus facilement le vent solaire, puisque nous n'avons pas de perturbations du soleil."
Depuis des décennies, les scientifiques ont rassemblé des observations pendant ces périodes de minimum solaire, un effort co-dirigé par Sarah Gibson, un scientifique solaire à l'Observatoire de haute altitude, et d'autres scientifiques. Pour chacune des trois dernières périodes de minimum solaire, les scientifiques ont regroupé les observations d'une liste sans cesse croissante d'observatoires dans l'espace et au sol, en espérant que la richesse des données sur le vent solaire non perturbé dévoilerait de nouvelles informations sur sa formation et son évolution. Pour cette période solaire minimale, les scientifiques ont commencé à recueillir des observations coordonnées à partir du début de 2019 sous l'égide de l'ensemble de l'héliosphère et des interactions planétaires, ou WHPI pour faire court.
Cette campagne WHPI particulière comprenait une bande d'observations plus large que jamais :couvrant non seulement le soleil et ses effets sur la Terre, mais aussi des données recueillies sur Mars et la nature de l'espace dans tout le système solaire, le tout de concert avec le quatrième et le plus proche survol du soleil de Parker Solar Probe.
Les organisateurs du WHPI ont réuni des observateurs du monde entier et au-delà. La combinaison des données de dizaines d'observatoires sur Terre et dans l'espace donne aux scientifiques l'occasion de brosser ce qui pourrait être l'image la plus complète jamais réalisée du vent solaire :à partir d'images de sa naissance avec des télescopes solaires, aux échantillons peu de temps après sa sortie du soleil avec Parker Solar Probe, aux observations multipoints de son état changeant dans l'espace.
Lisez la suite pour voir des échantillons des types de données capturées au cours de cette collaboration internationale d'observatoires solaires et spatiaux.
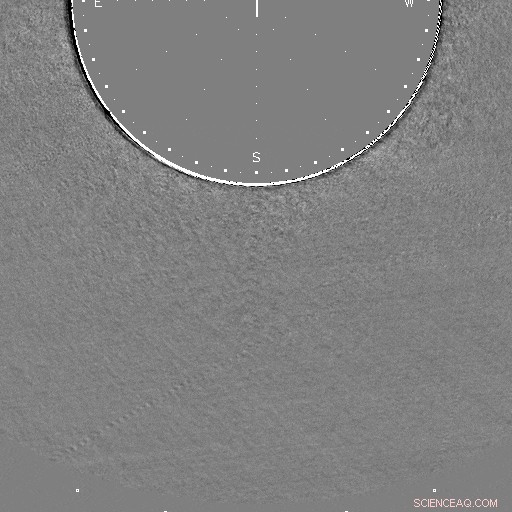
Les données de l'observatoire solaire de Mauna Loa à Hawaï montrent un jet de matière éjecté près du pôle sud du Soleil le 21 janvier 2020 (UTC). Cette image de différence est créée en soustrayant les pixels de l'image précédente de l'image actuelle pour mettre en évidence les changements. Crédit :Observatoire solaire de Mauna Loa/K-Cor
Sonde solaire Parker
Les premières données du passage rapproché de Parker Solar Probe par le soleil pendant la campagne WHPI montrent un système de vent solaire plus dynamique que ce qui est visible dans les observations près de la Terre. En particulier, les scientifiques espèrent que l'ensemble complet des données, en liaison descendante vers la Terre en mai 2020, révélera des structures dynamiques, comme de minuscules éjections de masse coronale et des cordes de flux magnétique dans leurs premiers stades de développement, cela ne peut pas être vu avec d'autres observatoires qui regardent de plus loin. Des structures de connexion comme celle-ci, auparavant trop petit ou trop éloigné pour être vu, avec les mesures du vent solaire et de la proximité de la Terre peuvent aider les scientifiques à mieux comprendre comment le vent solaire change tout au long de sa vie et comment ses origines proches du soleil affectent son comportement dans tout le système solaire.
Observatoire solaire du Mauna Loa
Les vues rapprochées de Parker Solar Probe sur les structures éoliennes solaires sont complétées par des observatoires solaires sur Terre et dans l'espace, qui ont un champ de vision plus large pour capturer les structures éoliennes solaires.
Les données de l'observatoire solaire de Mauna Loa à Hawaï montrent un jet de matière éjecté près du pôle sud du soleil le 21 janvier 2020. Les jets coronaux comme celui-ci sont une caractéristique du vent solaire que les scientifiques espèrent observer de plus près avec Parker Solar Probe, car les mécanismes qui les créent pourraient éclairer davantage la naissance et l'accélération du vent solaire.
"Ce serait extrêmement chanceux si Parker Solar Probe observait ce jet, puisqu'il fournirait des informations sur le plasma et le champ dans et autour du jet peu de temps après sa formation, " dit Joan Burkepile, scientifique principal pour l'instrument K-coronagraphe de l'Observatoire du magnétisme solaire coronal à l'Observatoire solaire de Mauna Loa, qui a capturé ces images.
Solar and Terrestrial Relations Observatory
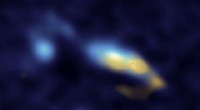
Along with observations of the solar wind from Parker Solar Probe and near Earth, scientists also have detailed images of the sun and its atmosphere from spacecraft like NASA's Solar Dynamics Observatory and the Solar and Terrestrial Relations Observatory. NASA's Solar and Terrestrial Relations Observatory, or STEREO, has a distinct view of the sun from its vantage point about 78 degrees away from Earth.
During this WHPI campaign, scientists took advantage of this unique viewing angle. From Jan. 21-23—when Parker Solar Probe and STEREO were aligned—the STEREO mission team increased the exposure length and frequency of images taken by its coronagraph, revealing fine structures in the solar wind as they speed out from the sun.
These difference images are created by subtracting the pixels of a previous image from the current image to highlight changes—here, revealing a small CME that would otherwise be difficult to see.
The Solar Dynamics Observatory, or SDO, takes high-resolution views of the entire sun, revealing fine details on the solar surface and the lower solar atmosphere. These images were captured in a wavelength of extreme ultraviolet light at 171 Angstroms, highlighting the quiet parts of the sun's outer atmosphere, the corona. This data—along with SDO's images in other wavelengths—maps much of the sun's activity, allowing scientists to connect solar wind measurements from Parker Solar Probe and other spacecraft with their possible origins on the sun.
Modeling the Data
Ideally, scientists could use these images to readily pinpoint the region on the sun that produced a particular stream of solar wind measured by Parker Solar Probe—but identifying the source of any given solar wind stream observed by a spacecraft is not simple. En général, the magnetic field lines that guide the solar wind's movement flow out of the Northern half of the sun point in the opposite direction than they do in the Southern half. In early 2020, Parker Solar Probe's position was right at the boundary between the two—an area known as the heliospheric current sheet.
"For this perihelion, Parker Solar Probe was very close to the current sheet, so a little nudge one way or the other would make the magnetic footpoint shift to the south or north pole, " said Nick Arge, a solar scientist at NASA's Goddard Space Flight Center in Greenbelt, Maryland. "We were on the tipping point where sometimes it went north, sometimes south."
Predicting which side of the tipping point Parker Solar Probe was on was the responsibility of the modeling teams. Using what we know about the sun's magnetic field and the clues we can glean from distant images of the sun, they made day-by-day predictions of where, précisément, on the sun birthed the solar wind that Parker would fly through on a given day. Several modeling groups made daily attempts to answer just that question.
Using measurements of the magnetic field at the sun's surface, each group made a daily prediction for the source region producing the solar wind that Parker Solar Probe was flying through.
Arge worked with Shaela Jones, a solar scientist at NASA Goddard who did daily forecasting during the WHPI campaign, using a model originally developed by Arge and colleagues Yi-Ming Wang and Neil Sheeley, called the WSA model. According to their forecasts, the predicted source of the solar wind switched between hemispheres suddenly during the observation campaign, because Earth's orbit at the time was also closely aligned with the heliospheric current sheet—that region where the direction of magnetic polarity and the source of the solar wind switches between north and south. They predicted that Parker Solar Probe, flying in a similar plane as Earth, would experience similar switches in solar wind source and magnetic polarity as it flew near the sun.
Solar wind models rely on daily measurements of the sun's surface magnetic field—the black and white image underlaid. This particular model used measurements from the National Solar Observatory's Global Oscillation Network Group and a model that focuses on predicting how the sun's surface magnetic field will change over several days. Creating these magnetic surface maps is a complicated and imperfect process unto itself, and some of the modeling groups participating in the WHPI campaign also used magnetic measurements from multiple observatories. Cette, along with differences in each group's models, created a spread of predictions that sometimes placed the source of Parker Solar Probe's solar wind stream in two different hemispheres of the sun. But given the inherent uncertainty in modeling the solar wind's source, these different predictions can actually make for more robust operations.
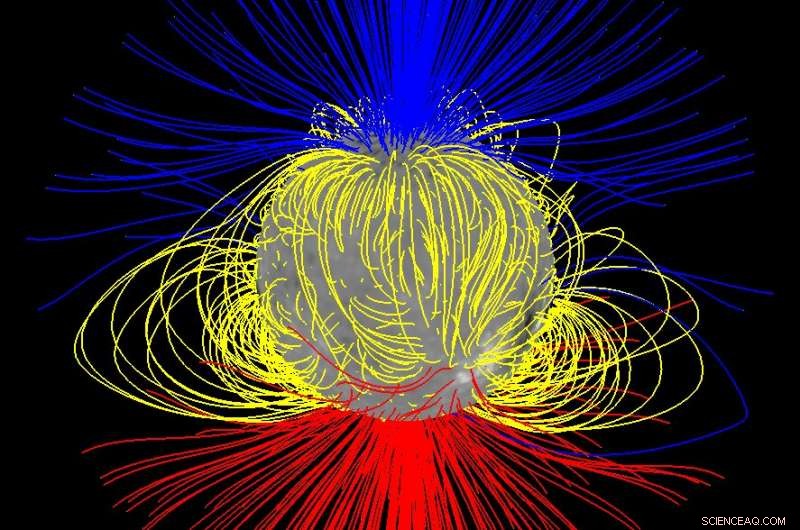
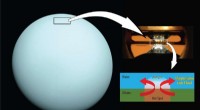
The sun's "open" magnetic field — shown in this model in blue and red, with looped or closed field shown in yellow — primarily comes from near the Sun's north and south poles during solar minimum, but it spreads out to fill space converging near the Sun's equator. Credit:NASA/Nick Arge
"If you can observe the sun in two different places with two telescopes, you have a better chance to get the right spot, " dit Jones.
Poker Flat Incoherent Scatter Radar
The solar wind carries with it both an enormous amount of energy and the embedded magnetic field of the sun. When it reaches Earth, it can ring our planet's natural magnetic field like a bell, making it bend and deform—which produces a measurable change in magnetic field strength at certain points on Earth's surface. We track those changes because magnetic field oscillations can lead to a host of space weather effects that interfere with spacecraft or even, occasionally, utility grids on the ground.
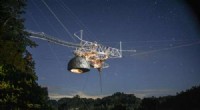
A host of ground-based magnetometers have tracked these effects since the 1850s, and they're one of the many sets of data scientists are gathering in connection with this campaign. Other ground-based instruments can reveal the invisible effects of space weather in our atmosphere. One such system is the Poker Flat Incoherent Scatter Radar, or PFISR—a radar system based at the Poker Flat Research Range near Fairbanks, Alaska.
This radar is specially tuned to detect one of most reliable indicators of a disturbance in Earth's magnetic field:electrons in Earth's upper atmosphere. These electrons are created when particles trapped in the magnetosphere are sent zooming into Earth's atmosphere by a complex series of events, a set of circumstances known as a magnetospheric substorm.
On Jan. 16, PFISR measured the changing electrons in Earth's upper atmosphere during one such substorm. During a substorm, particles cascade into the upper atmosphere, not only creating the shower of electrons measured by the radar, but driving a more visible effect:the aurora. PFISR uses multiple beams of radar oriented in different directions, which allowed scientists to build up a three-dimensional picture of how electrons in the atmosphere changed throughout the substorm.
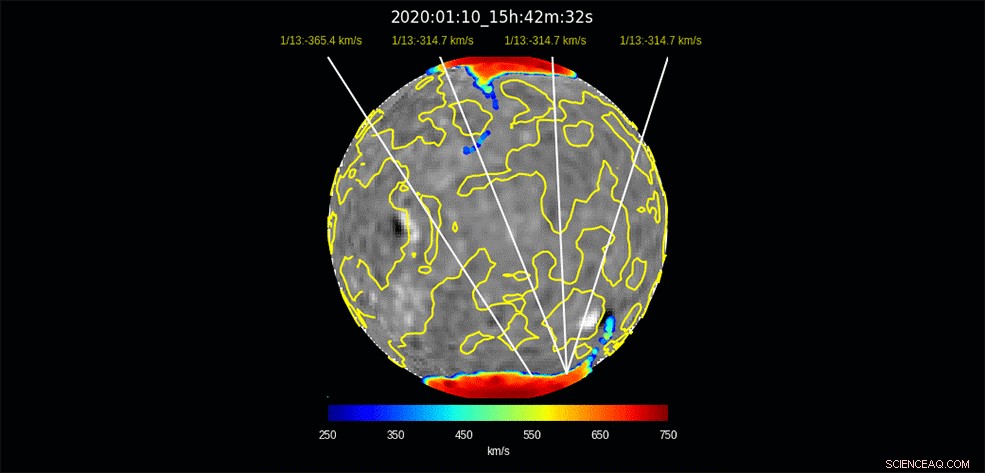
This model run — produced by Nick Arge and Shaela Jones using the WSA model — illustrates the predicted origin for solar wind that will impact Earth days later, spanning Jan. 10 – Feb. 3, 2020. The colored regions near the sun's north and south poles show the regions from which the solar wind flows out, with red regions showing a faster flow and blue regions showing a slower flow. The yellow lines on the sun divide areas of opposite magnetic polarity. The white lines indicate the predicted points of origin for the solar wind arriving at Earth at the given date. The black and white underlaid image shows a map of the magnetic field at the sun's surface, the basis for the model's predictions. The black regions are where the magnetic field points inward, toward the sun, and white regions are where the field points outward, away from the sun. Credit:NASA/Nick Arge/Shaela Jones
Because this substorm took place so early in the observation campaign—only one day after data collection began—it's unlikely that it was caused by conditions on the sun observed during the campaign. But even so, the connection between magnetospheric substorms and the broader, global-scale effects created by the solar wind—called geomagnetic storms—isn't entirely understood.
"This substorm didn't happen during a geomagnetic storm time, " said Roger Varney, principal investigator for PFISR at SRI International in Menlo Park, Californie. "The solar wind during this event is fluctuating, but not particularly strongly—it's basically background noise. But solar wind is basically never steady; it's constantly putting some energy into the magnetosphere."
This deposit of energy into Earth's magnetic system has far-reaching effects:for one, changes in the composition and density of Earth's upper atmosphere can garble communications and navigation signals, an effect often characterized by total electron content. Changes in density can also affect the orbits of satellites to great degree, introducing uncertainty about precise position.
MAVEN
Earth isn't the only planet where the solar wind has measurable effects—and studying other worlds in our solar system can help scientists understand some of the solar wind's effects on Earth and how it influenced the evolution of Earth and other worlds throughout the solar system's history.
At Mars, the solar wind coupled with Mars' lack of a global magnetic field may be a major factor in the dry, barren world the Red Planet is today. Though Mars was once much like Earth—warm, with liquid water and a thick atmosphere—the planet has changed drastically over the course of its four-billion-year history, with most of its atmosphere being stripped away to space. With similar processes observed here on Earth, scientists leverage understanding of solar-planetary interactions at Mars to determine how processes leading to atmospheric escape has the ability to change whether a planet is habitable or not. Aujourd'hui, the Mars Atmosphere and Volatile Evolution mission, or MAVEN, studies these processes at Mars. MAVEN observations at Mars are available for this latest WHPI campaign.
Over the coming months, heliophysicists around the world will begin to study data from these observatories in depth, hoping to draw connections that reveal new knowledge about the sun and its changes that influence Earth and space across the solar system.
Parker Solar Probe is part of the NASA Heliophysics Living with a Star program to explore aspects of the sun-Earth system that directly affect life and society. The Living with a Star program is managed by the agency's Goddard Space Flight Center in Greenbelt, Maryland, for NASA's Science Mission Directorate in Washington. The Johns Hopkins Applied Physics Laboratory in Laurel, Maryland, conçu, built and operates the spacecraft and manages the mission for NASA.